अब से हम Elev8 हैं
हम केवल एक ब्रोकर नहीं हैं। हम एक ऑल-इन-वन ट्रेडिंग इकोसिस्टम हैं—आपको विश्लेषण करने, ट्रेड करने और बढ़ने के लिए जो कुछ भी चाहिए, वह एक ही स्थान पर है। क्या आप अपने ट्रेडिंग को ऊँचा उठाने के लिए तैयार हैं?
हम केवल एक ब्रोकर नहीं हैं। हम एक ऑल-इन-वन ट्रेडिंग इकोसिस्टम हैं—आपको विश्लेषण करने, ट्रेड करने और बढ़ने के लिए जो कुछ भी चाहिए, वह एक ही स्थान पर है। क्या आप अपने ट्रेडिंग को ऊँचा उठाने के लिए तैयार हैं?
Having marked a flash crash of more than 20%, WTI retraces to $32.37 during Tuesday’s Asian session.
While the recent recovery gains support from oversold RSI, buyers will wait for entry unless the black gold crosses December 2018 low and 38.2% Fibonacci retracement of its fall from early 2019, around $42.60.
In doing so, 10-day SMA near $43.50 and 50% Fibonacci retracement near $47.20 will entertain the buyers ahead of pleasing them with the monthly top surrounding $48.75.
Alternatively, the intra-day low near $30.50 and $30.00 round-figure may offer small rests to the energy benchmark during the fresh declines.
However, any further downside might not hesitate to slip beneath $27.70.
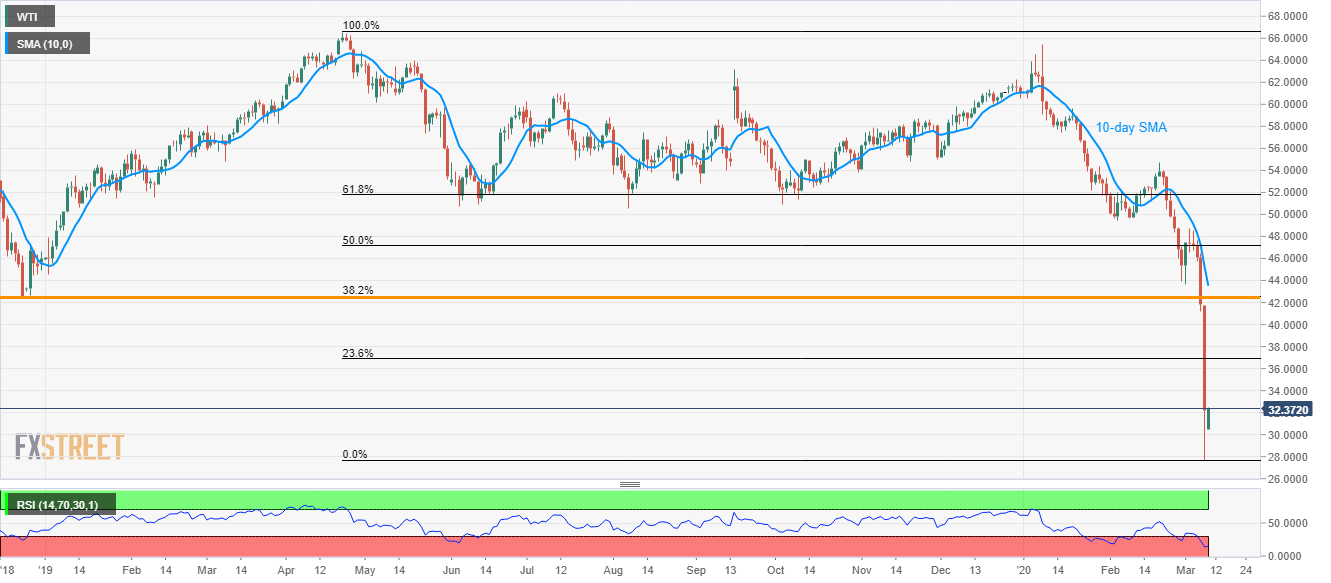
Trend: Pullback expected