اب سے ہم Elev8 ہیں
ہم صرف ایک بروکر نہیں ہیں۔ ہم ایک جامع ٹریڈنگ ایکوسسٹم ہیں—ہر چیز جو آپ کو تجزیے، ٹریڈ اور ترقی کے لیے درکار ہو، ایک ہی جگہ پر ہے۔ کیا آپ اپنی ٹریڈنگ کو بلند کرنے کے لیے تیار ہیں؟
ہم صرف ایک بروکر نہیں ہیں۔ ہم ایک جامع ٹریڈنگ ایکوسسٹم ہیں—ہر چیز جو آپ کو تجزیے، ٹریڈ اور ترقی کے لیے درکار ہو، ایک ہی جگہ پر ہے۔ کیا آپ اپنی ٹریڈنگ کو بلند کرنے کے لیے تیار ہیں؟
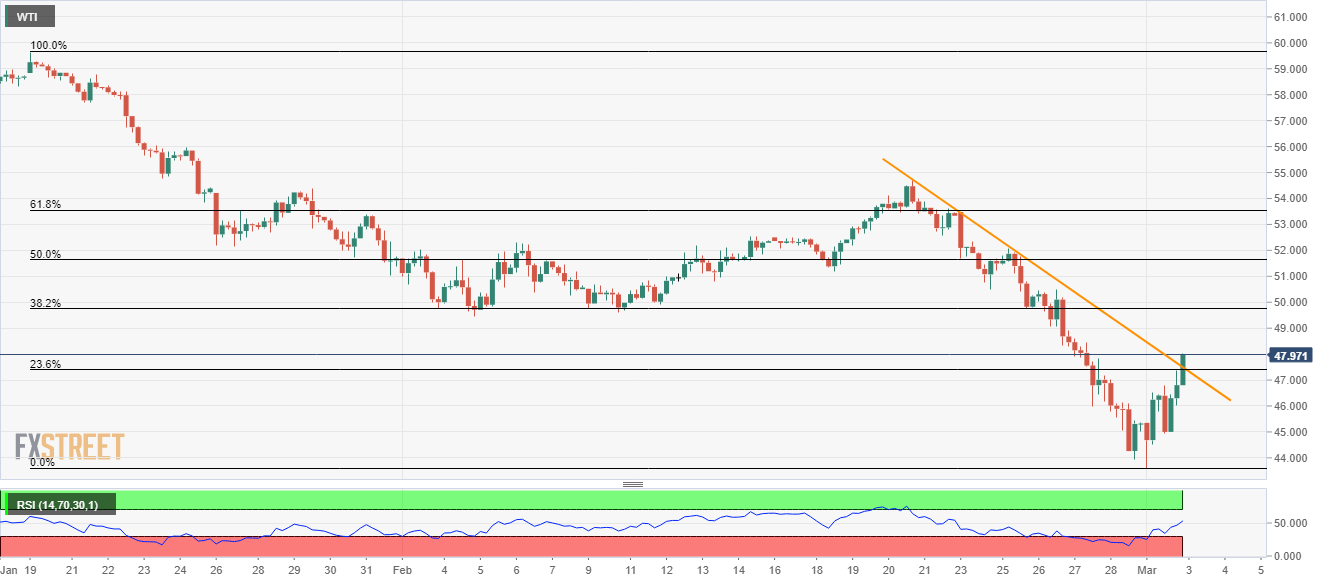
While carrying its recovery from the multi-month lows, flashed Friday, WTI takes the bids to $47.60 during the early Asian session on Tuesday. In doing so, the black gold breaks a short-term falling trend line stretched since February 20, 2020, to take aim at 38.2% Fibonacci retracement of its January-February declines.
During the energy benchmark’s sustained break of the aforementioned resistance line, backed by successful trading beyond 38.2% Fibonacci retracement level of $49.75, 50% and 61.8% Fibonacci retracement levels surrounding $51.65 and $53.55 will gain the buyers’ attention.
However, any upside beyond the February month top close to $54.70 will not refrain to challenge the late-January tops near $56.00.
Alternatively, $46.50 and the recent low near $43.60 could keep the oil’s near-term declines limited.
In a case where the black gold slips below $43.60, December 2018 low near $42.15 will be on their radars.
Trend: Pullback expected