A partir de ahora somos Elev8
Somos más que un simple corredor. Somos un ecosistema de trading todo en uno: todo lo que necesitas para analizar, operar y crecer está en un solo lugar. ¿Listo para elevar tu trading?
Somos más que un simple corredor. Somos un ecosistema de trading todo en uno: todo lo que necesitas para analizar, operar y crecer está en un solo lugar. ¿Listo para elevar tu trading?
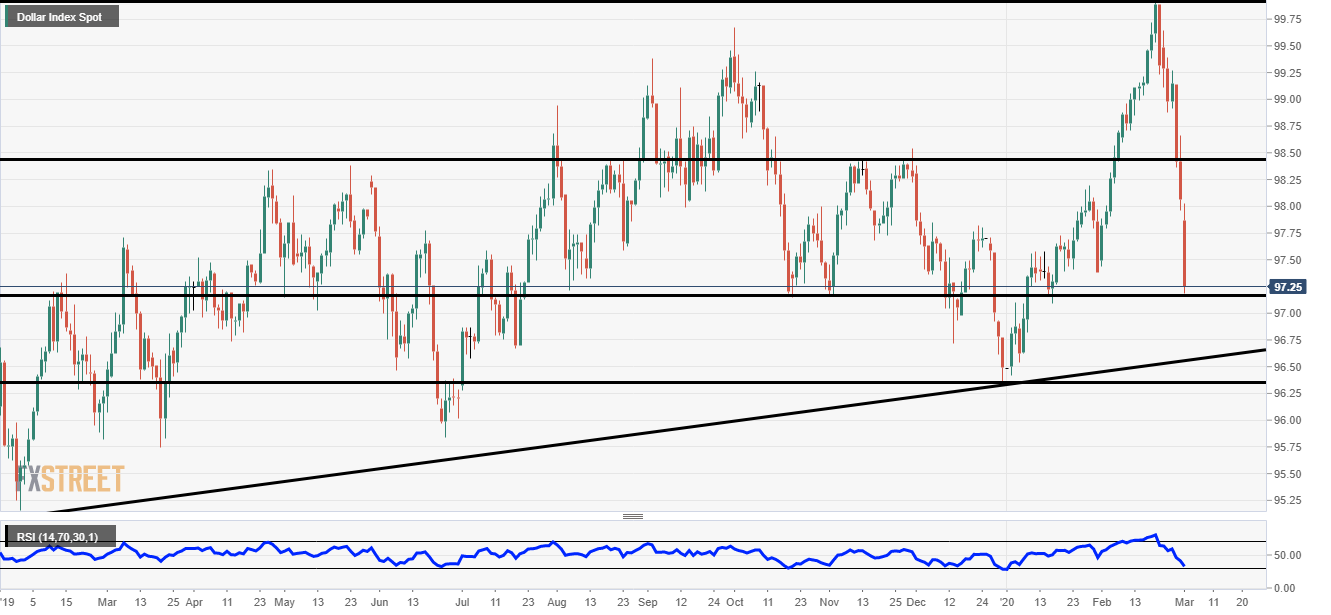
The daily chart below shows the extent of the capitulation in the Dollar Index.
The price seems to have found some support at 97.25, this level we speak about more in the weekly chart section.
The level has been pretty useful in the past with at least 6 bounces on the chart below.
The interesting thing about this chart is the fact there has been no lower high and the price has fallen soo quickly.
The relative strength index (RSI) is also in a very oversold area and this could indicate a short term retracement is in order.
On the weekly charts, things look a lot less dramatic. The price is not near the bottom of the consolidation range just yet.
The key support is at 96.35 which is the previous wave low.
At the moment this chart highlights the fact that the 38.2% Fibonacci level has provided some support in the near term (97.25).
For me, the biggest support zone on the chart is at 95.00. It might take some time to get there but the level does look pretty strong.
As the futures market prices in more rate cuts from the Fed and the ECB members keep stating that the coronavirus needs more of a government fiscal response, the DXY could be in for more pain.
Shorter-term we must remember the price is at very oversold levels and this could lead to a retracement.
-637187700232128909.png)