Kể từ bây giờ chúng tôi là Elev8
Chúng tôi không chỉ là một nhà môi giới. Chúng tôi là một hệ sinh thái giao dịch tất cả trong một—mọi thứ bạn cần để phân tích, giao dịch và phát triển đều có ở một nơi. Sẵn sàng nâng tầm giao dịch của bạn?
Chúng tôi không chỉ là một nhà môi giới. Chúng tôi là một hệ sinh thái giao dịch tất cả trong một—mọi thứ bạn cần để phân tích, giao dịch và phát triển đều có ở một nơi. Sẵn sàng nâng tầm giao dịch của bạn?
Despite bouncing off September 2018 lows, USD/CHF stays 0.11% down while trading around 0.9640 during early Monday. Also portraying the pair’s weakness are bearish conditions of MACD.
That said, a downward sloping trend line since early October 2019, at 0.9600 now, acts as the immediate support.
Also challenging the sellers is 61.8% Fibonacci retracement of the pair’s rise from February 2018 to April 2019, at 0.9585.
In a case where the bears manage to conquer 0.9585 on a weekly closing basis, September 2018 bottom surrounding 0.9540 will return to the charts.
Alternatively, 50% of Fibonacci retracement and late-February lows can question the pair’s immediate recovery around 0.9710 and 0.9770 respectively.
It should, however, be noted that the quote’s upside past-0.9770 will find it tough to cross 38.2% Fibonacci retracement and 200-week SMA, currently around 0.9835 and 0.9850 in that order.
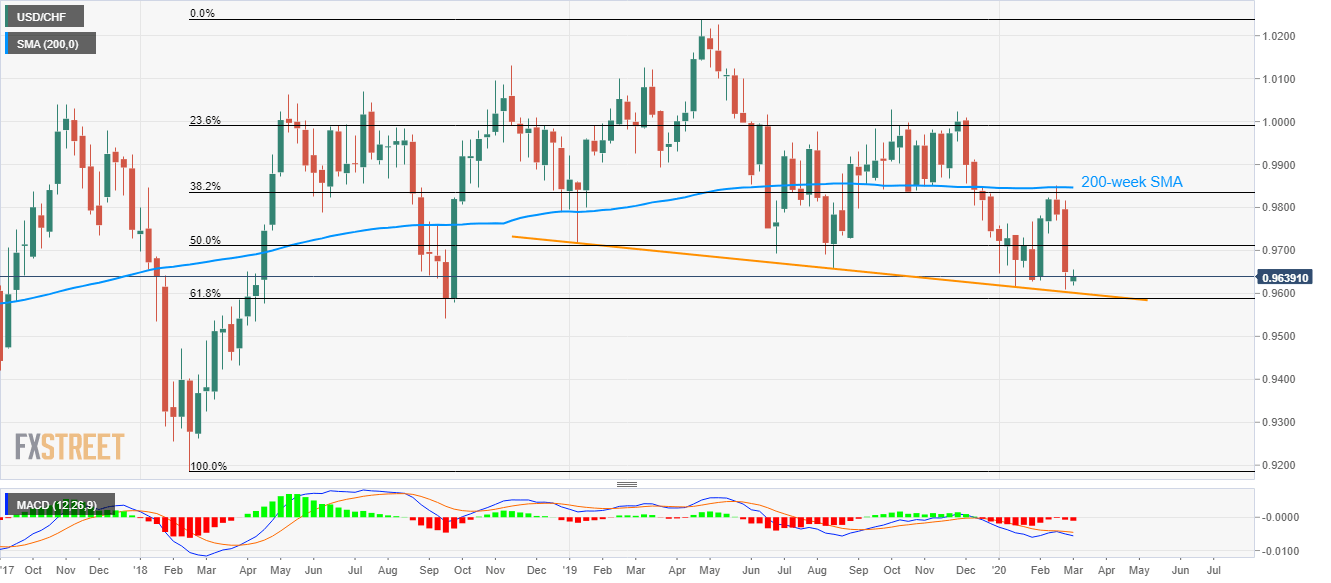
Trend: Bearish