Kể từ bây giờ chúng tôi là Elev8
Chúng tôi không chỉ là một nhà môi giới. Chúng tôi là một hệ sinh thái giao dịch tất cả trong một—mọi thứ bạn cần để phân tích, giao dịch và phát triển đều có ở một nơi. Sẵn sàng nâng tầm giao dịch của bạn?
Chúng tôi không chỉ là một nhà môi giới. Chúng tôi là một hệ sinh thái giao dịch tất cả trong một—mọi thứ bạn cần để phân tích, giao dịch và phát triển đều có ở một nơi. Sẵn sàng nâng tầm giao dịch của bạn?
NZD/USD remains on the back foot while trading around 0.6607 during the pre-European session on Tuesday. The pair nears an upward sloping trend line since December 18 as well as 38.2% Fibonacci retracement level of the pair’s November-December upside.
Should bearish MACD drag NZD/USD prices below 0.6590/88 support confluence, 50% Fibonacci retracement near 0.6535 could gain the market’s attention.
During the pair’s further downside past-0.6535, 0.6500 and November 04 top near 0.6465 can please the sellers.
On the contrary, 21-day SMA and 23.6% Fibonacci retracement restrict short-term upside around 0.6650/55.
Buyers will wait for a daily closing beyond 0.6655 to aim for 0.6700 and 2019 close near 0.6755.
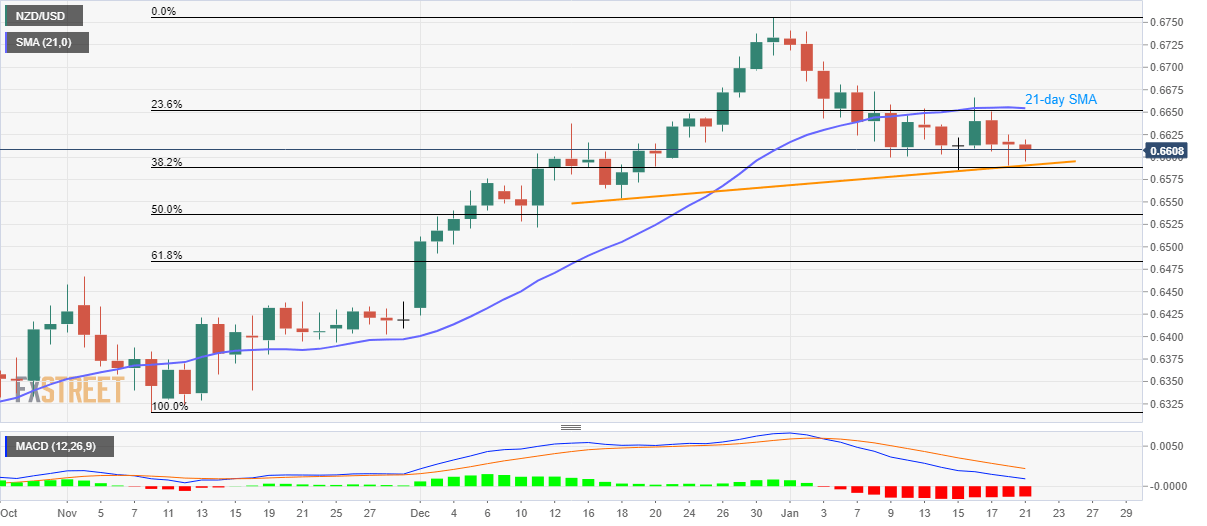
Trend: Pullback expected