Kể từ bây giờ chúng tôi là Elev8
Chúng tôi không chỉ là một nhà môi giới. Chúng tôi là một hệ sinh thái giao dịch tất cả trong một—mọi thứ bạn cần để phân tích, giao dịch và phát triển đều có ở một nơi. Sẵn sàng nâng tầm giao dịch của bạn?
Chúng tôi không chỉ là một nhà môi giới. Chúng tôi là một hệ sinh thái giao dịch tất cả trong một—mọi thứ bạn cần để phân tích, giao dịch và phát triển đều có ở một nơi. Sẵn sàng nâng tầm giao dịch của bạn?
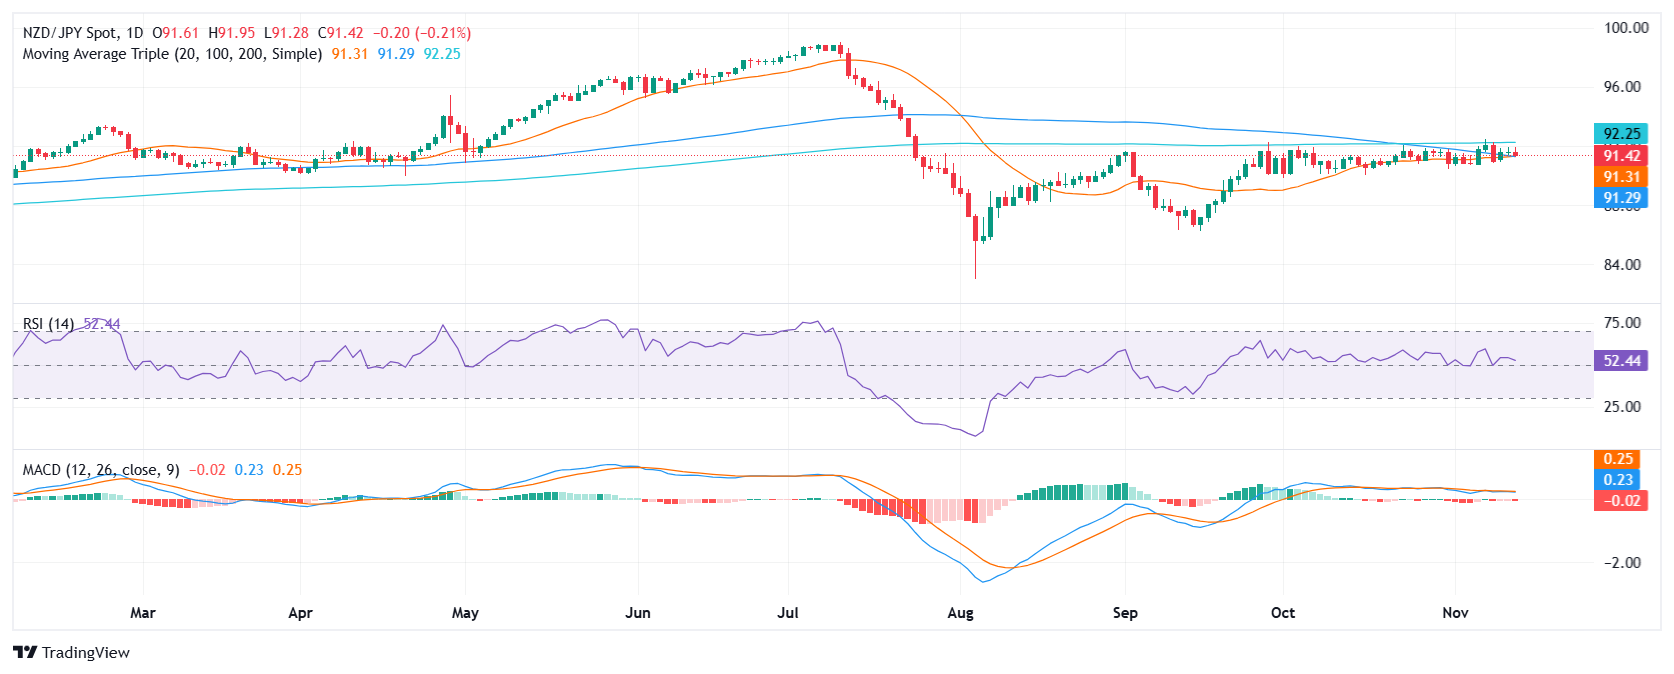
The NZD/JPY pair witnessed a slight pullback during Wednesday's session, dipping below the 91.50 level. This retracement follows a period of gains on Tuesday, but the pair remains confined within a clear trading channel between 92.00 and 91.00. Additionally A bearish crossover, recently completed between the 20 and 100-day Simple Moving Average (SMA) might push the pair lower.
Technically, the Relative Strength Index (RSI) suggests that buying pressure is declining, as it stands at 53, in positive terrain, but declining. Additionally, the Moving Average Convergence Divergence (MACD) histogram is flat and red, suggesting that selling pressure is present. Therefore, the overall outlook for the pair remains mixed, and it is worth monitoring the price action around the 91.00 and 92.00 boundaries.
Support levels are located at 91.00, 90.50, and 90.00, while resistance levels are at 92.00, 92.50, and 93.00.